Introduction to Bollinger Bands
Bollinger Bands are a highly regarded technical analysis tool developed by John Bollinger in the 1980s. They measure market volatility and are typically plotted two standard deviations away from a simple moving average (SMA). The bands expand and contract based on market volatility, with wider bands indicating high volatility and narrower bands indicating low volatility. This characteristic makes Bollinger Bands particularly useful in identifying potential market breakout points, which leads us to the Bollinger Band Squeeze technique.
Understanding the Bollinger Band Squeeze
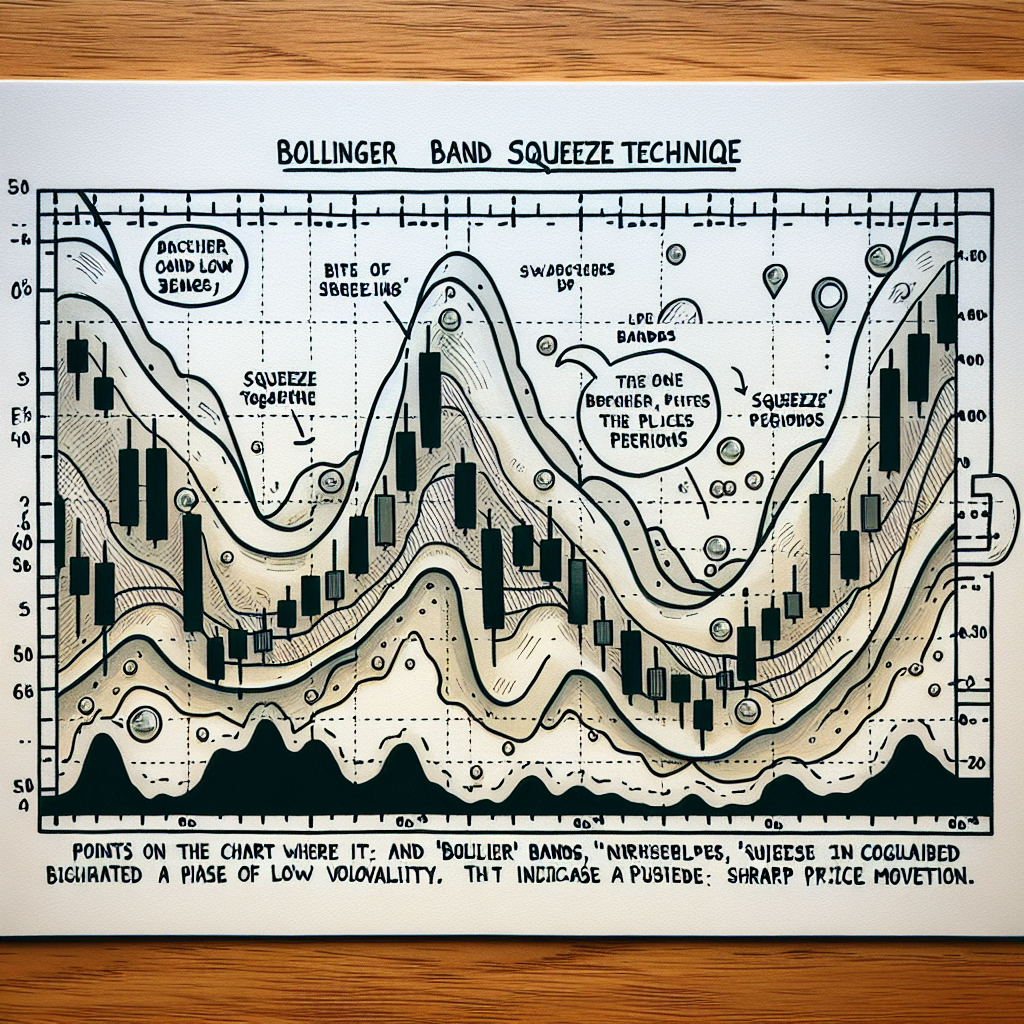
The Bollinger Band Squeeze is a strategy that capitalizes on the periods of low volatility represented by the narrowing of the Bollinger Bands. It is predicated on the principle that the market moves from periods of low volatility to high volatility and vice versa. The squeeze is considered a precursor to a major price breakout. Identifying a squeeze situation can thus provide traders with a signal to anticipate a significant price move in either direction.
Identifying a Bollinger Band Squeeze
A squeeze situation is identified when the Bollinger Bands are at their narrowest in the last n periods (time frames can vary based on preference, but 6 months is a common benchmark). This is often accompanied by a flat or nearly flat SMA, indicating that the price has also been relatively stable.
Significance of the Squeeze
The significance of the Bollinger Band Squeeze cannot be overstated. Traders see it as a sign that the market is consolidating and that a breakout is imminent. The direction of the breakout, however, is not indicated by the squeeze itself, meaning that traders need to use other technical indicators or analysis methods to predict the potential direction of the breakout.
Trading the Bollinger Band Squeeze
Once a squeeze has been identified, the next step is to prepare for the breakout. This involves closely watching the stock or asset for a break above or below the bands, which would indicate the direction of the market’s likely move.
Entry Points
Traders often enter the market once the price breaks above the upper band or below the lower band following a squeeze. A break above the upper band indicates bullish momentum, suggesting a buy signal, while a break below the lower band indicates bearish momentum, suggesting a sell signal.
Exit Strategies
Exit strategies following a Bollinger Band Squeeze breakout can vary significantly among traders. Some may set a specific profit target or stop-loss level, while others may exit their position when the price touches the moving average within the bands. Another common strategy is to exit when the bands start to expand significantly, indicating that the initial breakout momentum may be waning.
Combining with Other Indicators
To increase the effectiveness of the Bollinger Band Squeeze technique, traders often combine it with other indicators. Popular choices include the Relative Strength Index (RSI) for assessing overbought or oversold conditions, the Moving Average Convergence Divergence (MACD) for additional confirmation of the breakout direction, and volume indicators to confirm the strength of the breakout.
Conclusion
The Bollinger Band Squeeze technique is a powerful strategy in the trader’s arsenal for capitalizing on periods of low market volatility. By understanding and identifying the squeeze, traders can prepare for and potentially profit from significant market breakouts. However, as with all trading strategies, it is essential to combine the Bollinger Band Squeeze with other indicators and sound risk management practices to maximize success.