Mastering MACD Crossovers: A Trader’s Guide
Introduction to MACD Crossovers
The Moving Average Convergence Divergence (MACD) is a powerful tool in the trader’s arsenal, renowned for its effectiveness in signaling changes in momentum and potential market direction shifts. Understanding how to trade with MACD crossovers allows traders to make informed decisions, enhancing their strategy whether in stocks, forex, or commodities markets. This guide will take you through what MACD is, how it works, and how to effectively trade using MACD crossovers.
What is MACD?
The MACD is a trend-following momentum indicator that shows the relationship between two moving averages of a security’s price. It is calculated by subtracting the 26-period Exponential Moving Average (EMA) from the 12-period EMA. The result of this calculation is the MACD line. A nine-day EMA of the MACD called the “signal line,” is then plotted on top of the MACD line, which can function as a trigger for buy and sell signals.
Understanding MACD Crossovers
The Basics
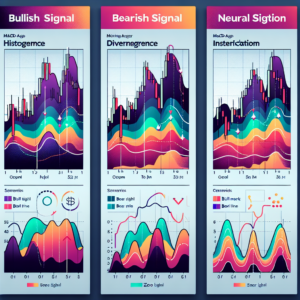
MACD crossovers occur when the MACD line and the signal line cross over each other. These crossovers signal that a change in the trend of the asset’s price is likely happening. There are two primary types of MACD crossovers: the bullish crossover and the bearish crossover.
Bullish Crossover
A bullish crossover occurs when the MACD line moves above the signal line, suggesting that it might be a good time to buy because upward momentum is potentially increasing. This is considered a buy signal in many trading strategies.
Bearish Crossover
Conversely, a bearish crossover happens when the MACD line falls below the signal line, indicating possible selling pressure and a potential sell signal. This suggests that the asset’s price might be entering a downtrend, and it might be a good time to sell or short.
Trading with MACD Crossovers
Step 1: Setting Up Your Chart
First, choose a security or market that you wish to trade. Then, set up your chart to display both the price of the asset and the MACD indicator. Most trading platforms will allow you to add the MACD indicator easily.
Step 2: Identifying Crossovers
Watch for when the MACD line crosses above or below the signal line. These are your initial signals for potential trades. Document these occurrences and prepare to analyze them in the context of the broader market.
Step 3: Confirming the Signal
Before acting on a MACD crossover, it’s wise to seek confirmation from other indicators or patterns. Look for supporting signals such as a breakout from a resistance or support level, volume increases, or confirmations from other indicators like RSI or Stochastics.
Step 4: Execution
Once you have a confirmed signal, decide on your entry point, stop loss, and take profit levels. This allows for structured trade management, minimizing potential losses while also locking in profits. Execution should be timely to capitalize on the momentum signal provided by the MACD crossover.
Conclusion
Trading with MACD crossovers can be a powerful strategy when used correctly. By understanding the basics of how MACD works and following a disciplined approach to trading and analysis, traders can use MACD crossovers as effective signals for entering and exiting trades. Always remember, no indicator works all the time, so complementing MACD analysis with other indicators and sound risk management practices is essential for long-term success.