Algorithmic Trading with Technical Indicators
Introduction
Algorithmic trading, also known as automated trading or black-box trading, is a method of trading financial assets using pre-programmed algorithms. These algorithms are designed to execute trades based on specific rules and criteria, often incorporating technical indicators. In this article, we will explore the use of technical indicators in algorithmic trading and how they can be integrated into trading strategies.
What are Technical Indicators?
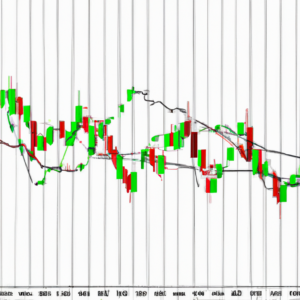
Technical indicators are mathematical calculations or visual representations of market data used to analyze and predict price movements in financial markets. They are typically displayed as overlays on price charts and provide traders with insights into market trends, volatility, and potential buy or sell signals. Some commonly used technical indicators include moving averages, relative strength index (RSI), stochastic oscillator, and Bollinger Bands.
Integrating Technical Indicators in Algorithmic Trading
Algorithmic trading strategies often rely on technical indicators to identify trading opportunities and make informed decisions. Here are the steps involved in integrating technical indicators into algorithmic trading:
Step 1: Define the Trading Strategy
Before incorporating technical indicators, it is crucial to define a trading strategy. This includes determining the asset(s) to trade, the time frame, and the desired risk-reward ratio. The trading strategy will serve as the foundation for integrating technical indicators.
Step 2: Select the Appropriate Indicators
Once the trading strategy is defined, select the technical indicators that align with the chosen approach. For example, if the strategy focuses on trend-following, moving averages or trend lines could be suitable indicators. If the strategy aims to identify overbought or oversold conditions, oscillators like RSI or stochastic can be considered.
Step 3: Set Indicator Parameters
Technical indicators often require specific parameters to be set, such as the period length for moving averages or the overbought/oversold thresholds for oscillators. These parameters can be optimized through backtesting or adjusted based on market conditions and historical data analysis.
Step 4: Implement the Indicators in Trading Algorithms
Once the indicators and their parameters are defined, they need to be implemented within the trading algorithms. This involves writing code that calculates the indicator values based on historical price data and triggers buy or sell signals when specific conditions are met.
Step 5: Backtest and Optimize
To ensure the effectiveness of the algorithmic trading strategy, it is essential to backtest it using historical market data. This allows traders to assess the performance of the strategy under different market conditions and make necessary adjustments to optimize its profitability and risk management.
Step 6: Monitor and Refine
After deploying the algorithmic trading strategy, it is crucial to continuously monitor its performance and make refinements as needed. Market conditions change, and indicators that were once effective may lose their predictive power. Regularly reviewing and updating the strategy can help adapt to evolving market dynamics.
Conclusion
Algorithmic trading with technical indicators is a powerful approach to automate trading decisions based on mathematical calculations and market data analysis. By integrating technical indicators into algorithmic trading strategies, traders can enhance their decision-making process and potentially improve trading performance. However, it is important to remember that no trading strategy or indicator is foolproof, and proper risk management and continuous monitoring are essential for successful algorithmic trading.


