Support/Resistance Trading Strategies: A Comprehensive Guide
Introduction
Support and resistance levels are essential concepts in technical analysis that help traders make informed decisions. These levels indicate price levels where an asset is likely to encounter buying (support) or selling (resistance) pressure. By understanding and utilizing support/resistance trading strategies, traders can identify potential entry and exit points, manage risk, and maximize profits. In this article, we will explore various support/resistance trading strategies that can enhance your trading skills.
1. Identifying Support and Resistance Levels
Before delving into trading strategies, it is crucial to identify support and resistance levels accurately. Here are a few methods to determine these levels:
a. Swing Highs and Lows
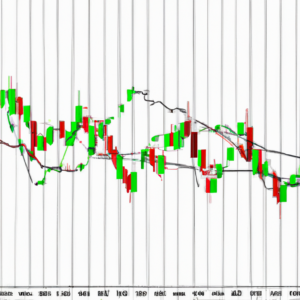
Swing highs represent peaks in price, while swing lows indicate valleys. Connect these points to draw horizontal lines, forming potential support and resistance levels.
b. Moving Averages
Moving averages, such as the 50-day or 200-day moving average, can act as dynamic support or resistance levels. When the price approaches or crosses these averages, they often influence market sentiment.
c. Fibonacci Retracement
Fibonacci retracement levels, derived from the Fibonacci sequence, are frequently used to identify potential support and resistance levels. Traders draw lines at specific percentages (e.g., 38.2%, 50%, 61.8%) to anticipate price reactions.
2. Support/Resistance Breakout Strategy
A breakout occurs when the price surpasses a significant support or resistance level. This strategy aims to capitalize on the momentum generated by the breakout. Here’s how to implement it:
a. Identify Key Support/Resistance Levels
Use the methods mentioned earlier to identify strong support or resistance levels that have been tested multiple times.
b. Wait for the Breakout
Monitor the price closely and wait for it to break decisively above resistance or below support. This breakout should be accompanied by substantial volume, indicating increased market participation.
c. Confirm the Breakout
To avoid false breakouts, wait for confirmation. Ensure the price continues to move in the breakout direction for a certain period or closes above/below the breakout level.
d. Enter the Trade
Once the breakout is confirmed, enter a trade in the direction of the breakout. Set stop-loss orders to manage risk and take-profit levels based on the size of the breakout.
3. Support/Resistance Pullback Strategy
This strategy focuses on trading pullbacks to support or resistance levels within an established trend. It allows traders to enter the market at favorable prices. Here’s how to implement it:
a. Identify the Trend
Determine the prevailing trend by analyzing price action or using trend indicators like moving averages. This strategy works best in trending markets.
b. Identify Pullbacks
Once the trend is identified, look for temporary price retracements or pullbacks against the trend. These pullbacks often find support or resistance at previous levels.
c. Confirm the Pullback
Wait for the price to bounce off the support or resistance level, indicating a potential continuation of the trend. Look for bullish or bearish candlestick patterns and use oscillators to confirm momentum.
d. Enter the Trade
Enter the trade when the pullback is confirmed, placing a stop-loss order below the recent swing low (for long trades) or above the recent swing high (for short trades). Set a profit target based on the size of the pullback or use trailing stops to maximize gains.
Conclusion
Support/resistance trading strategies provide traders with valuable insights into potential market turning points. By accurately identifying support and resistance levels and implementing breakout or pullback strategies, traders can enhance their trading performance. Remember to combine these strategies with proper risk management techniques and continuous learning to achieve consistent success in the dynamic world of trading.
