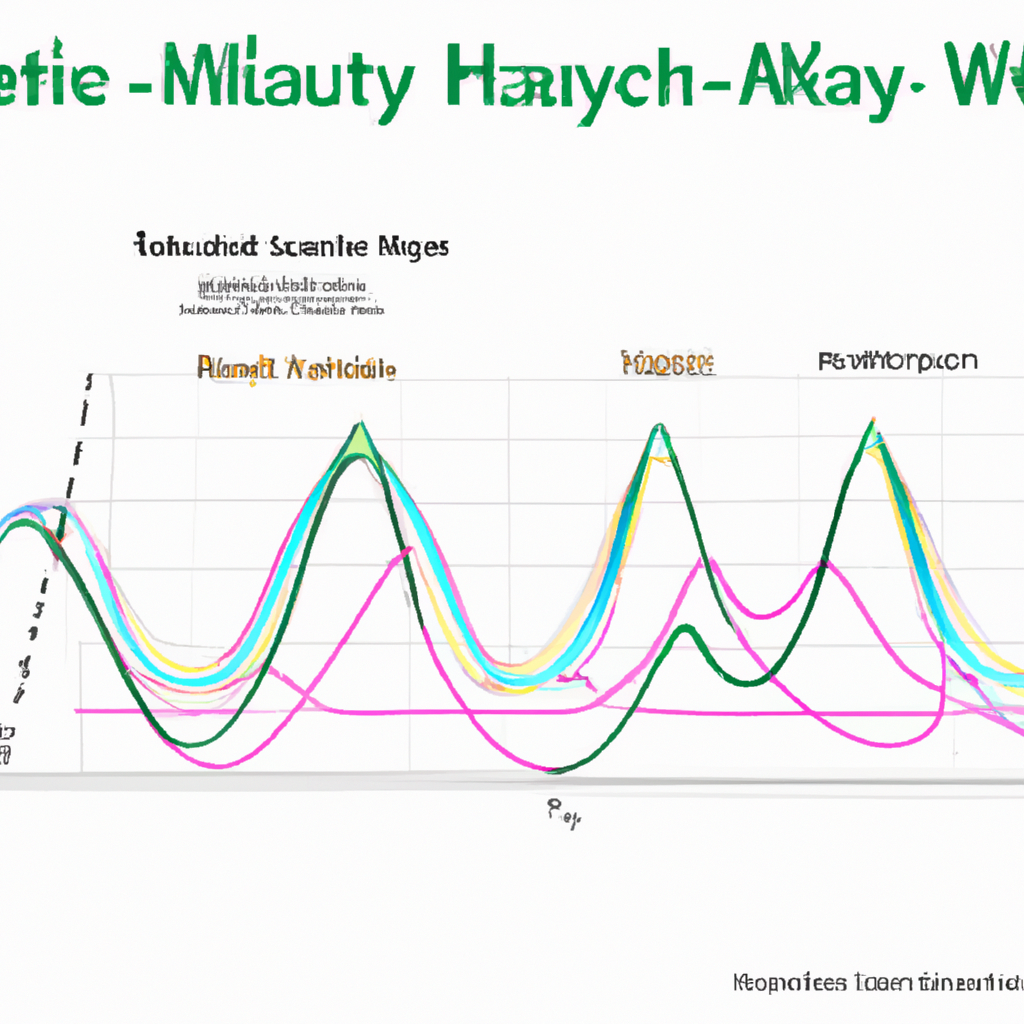
Introduction to Elliott Wave Analysis Methods
Elliott Wave analysis is a popular technical analysis method used by traders and investors to forecast future price movements in financial markets. It is based on the theory that market prices follow repetitive patterns, which are driven by the psychology of market participants. Developed by Ralph Nelson Elliott in the 1930s, this approach has gained significant popularity among traders looking to identify potential turning points and trends in the markets.
Understanding the Elliott Wave Principle
The Elliott Wave Principle is the foundation of Elliott Wave analysis. It suggests that market prices move in a series of five waves in the direction of the main trend, followed by a three-wave corrective pattern. These waves collectively form larger degree patterns, creating a fractal structure that can be observed in various timeframes.
The Five Wave Impulse Pattern
The first part of the Elliott Wave Principle is the five-wave impulse pattern, which represents the main trend. This pattern consists of three upward waves, labeled as waves 1, 3, and 5, and two downward waves, labeled as waves 2 and 4. The upward waves represent the bull market phases, while the downward waves represent the bear market phases.
Wave 1: Wave 1 is the initial move in the direction of the main trend. It is often driven by early adopters or investors who anticipate the upcoming trend change. Wave 1 is typically the shortest and least extensive wave in the five-wave pattern.
Wave 2: Wave 2 is a corrective wave that follows the completion of Wave 1. It represents a temporary pullback or correction against the main trend. Wave 2 usually retraces a portion of the gains made in Wave 1, but it should not exceed the starting point of Wave 1.
Wave 3: Wave 3 is the strongest and most extended wave in the five-wave pattern. It often exceeds the high of Wave 1 and is typically accompanied by increased volume and strong momentum. Wave 3 is often referred to as the “crown jewel” of the Elliott Wave pattern, as it tends to generate significant profits for traders who correctly identify it.
Wave 4: Wave 4 is another corrective wave that follows the completion of Wave 3. It represents a temporary pullback or consolidation before the final leg of the main trend. Wave 4 typically retraces a portion of the gains made in Wave 3, but it should not overlap with the price territory of Wave 1.
Wave 5: Wave 5 is the final wave in the five-wave pattern and represents the last push in the direction of the main trend. It is often accompanied by decreasing volume and momentum, indicating that the trend may be nearing exhaustion. Wave 5 is usually the longest or equal in length to Wave 3.
The Three Wave Corrective Pattern
Following the completion of the five-wave impulse pattern, the market undergoes a three-wave corrective pattern, labeled as A, B, and C. This pattern aims to retrace a portion of the previous impulse waves before the next impulse wave begins.
Wave A: Wave A is the first wave of the corrective pattern and represents a counter-trend move against the main trend. It typically retraces a portion of the previous five-wave impulse pattern and can take various forms, such as zigzags, flats, or triangles.
Wave B: Wave B is a corrective wave that follows Wave A. It represents a temporary pullback or correction against the counter-trend move. Wave B usually retraces a portion of the decline made in Wave A but should not exceed the starting point of Wave A.
Wave C: Wave C is the final wave in the corrective pattern and represents the resumption of the main trend. It aims to complete the correction and typically extends beyond the end of Wave A. Wave C is often the most powerful and profitable wave for traders who correctly anticipate its occurrence.
Applying Elliott Wave Analysis in Trading
Elliott Wave analysis can be a valuable tool for traders and investors in identifying potential entry and exit points in the markets. However, it requires practice, experience, and a deep understanding of the underlying principles. Here are some key considerations when applying Elliott Wave analysis in trading:
Identify the Correct Wave Count
Counting waves accurately is crucial in Elliott Wave analysis. Traders need to identify the correct wave count and determine the current position within the larger degree pattern. This can be challenging, as waves can have different degrees and can overlap or subdivide into smaller waves. Utilizing technical indicators, chart patterns, and other supporting tools can help confirm the wave count.
Confirm with Other Technical Analysis Tools
Elliott Wave analysis should not be used in isolation. It is important to confirm the wave count and potential price targets with other technical analysis tools, such as trendlines, support and resistance levels, moving averages, and oscillators. This helps to increase the probability of successful trades and reduce the risk of false signals.
Manage Risk and Set Realistic Expectations
Like any trading strategy, managing risk is crucial in Elliott Wave analysis. Traders should always use appropriate position sizing, set stop-loss orders, and have a clear plan for exit strategies. It is also important to set realistic expectations and understand that Elliott Wave analysis is not a crystal ball that predicts exact price movements. It provides a framework for understanding market psychology and potential price patterns.
Conclusion
Elliott Wave analysis methods offer traders and investors a unique perspective on market behavior by identifying repetitive price patterns driven by human psychology. While it requires practice and experience to master, this approach can provide valuable insights into potential market turning points and trends. By combining Elliott Wave analysis with other technical analysis tools and risk management strategies, traders can enhance their decision-making process and potentially improve their trading outcomes.


