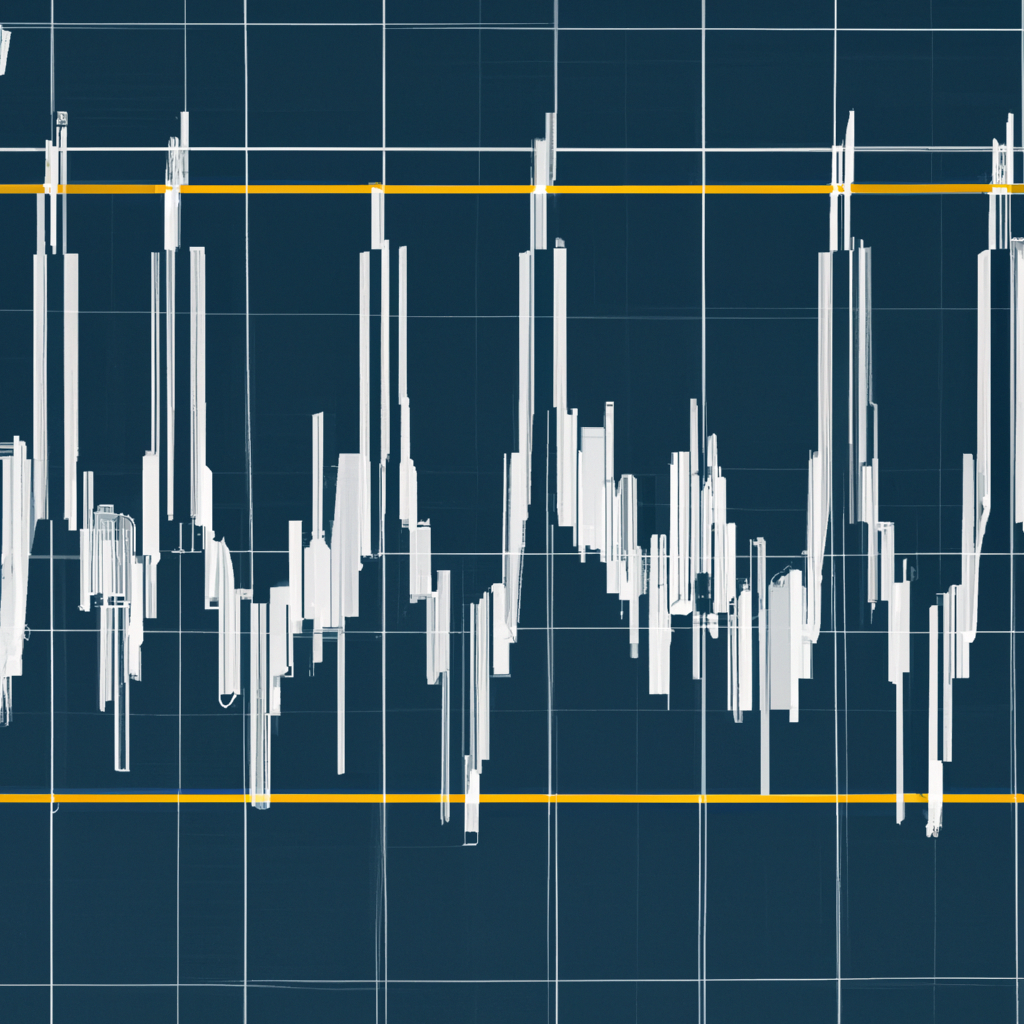
Trading with Harmonic Patterns: A Comprehensive Guide
Introduction
Harmonic patterns are powerful tools used by traders to identify potential market reversals and predict future price movements. These patterns are based on Fibonacci ratios and have proven to be highly accurate in spotting key turning points in the financial markets. In this article, we will explore the concept of trading with harmonic patterns and provide a step-by-step guide on how to effectively utilize them in your trading strategy.
Understanding Harmonic Patterns
Harmonic patterns are geometric price patterns that consist of specific price ratios derived from the Fibonacci sequence. These patterns are formed by a series of price swings and retracements, creating a unique structure on a price chart. The most commonly used harmonic patterns include the Butterfly, Gartley, Bat, and Crab patterns.
Identifying Harmonic Patterns
To identify harmonic patterns, traders must use specific tools or indicators that can automatically detect these patterns on price charts. There are various technical analysis software and charting platforms available that provide these features. Additionally, traders can manually identify harmonic patterns by analyzing price swings, retracements, and Fibonacci ratios.
Trading Strategies with Harmonic Patterns
Step 1: Identify the Harmonic Pattern
The first step in trading with harmonic patterns is to identify the pattern on the price chart. Once a pattern is detected, traders should confirm its validity by checking if the price swings and retracements align with the specific Fibonacci ratios associated with that pattern.
Step 2: Determine Potential Reversal Zones
After identifying the harmonic pattern, traders need to determine potential reversal zones where the price is likely to change its direction. These zones are typically located at the completion of the pattern and coincide with Fibonacci extension levels or other support/resistance areas on the chart.
Step 3: Confirm with Additional Indicators
While harmonic patterns are highly reliable, it is always recommended to confirm the potential reversal zones with additional technical indicators or tools. This can include trend lines, moving averages, or oscillators, which can provide further confirmation of the pattern’s validity.
Step 4: Plan Your Entry and Exit Strategy
Once the harmonic pattern is confirmed and additional indicators align, traders should plan their entry and exit strategy. This includes determining the optimal entry price, stop-loss level, and take-profit target. Risk management is crucial at this stage to ensure potential losses are minimized.
Step 5: Execute the Trade and Monitor
After planning the trade, it’s time to execute it. Traders should closely monitor the price action and make necessary adjustments to their stop-loss and take-profit levels as the trade progresses. It is also essential to adhere to the trading plan and avoid emotional decision-making.
Conclusion
Trading with harmonic patterns can significantly enhance a trader’s ability to spot potential market reversals and generate profitable trading opportunities. By understanding the concept of harmonic patterns, identifying them accurately, and implementing a well-defined trading strategy, traders can increase their chances of success in the financial markets. Remember to practice and backtest your strategies before applying them in live trading, and always prioritize risk management to protect your capital.


